Our Year at a Glance

Every year we respond to more than 28,000 incidents, as well as helping to prevent many more. Whether on land, sea or by air, we are proud to be able to help make WA a safer State. Putting the community first is at the heart of everything we do. This section provides a snapshot of what we have done this year and, where possible, provides a comparison with previous years.

361 new buildings inspected

Building inspections on site help DFES staff and developers work through safety issues or test fire safety systems.

153

2013-14

355

2014-15

226

2015-16

402

2016-17

361

2017-18

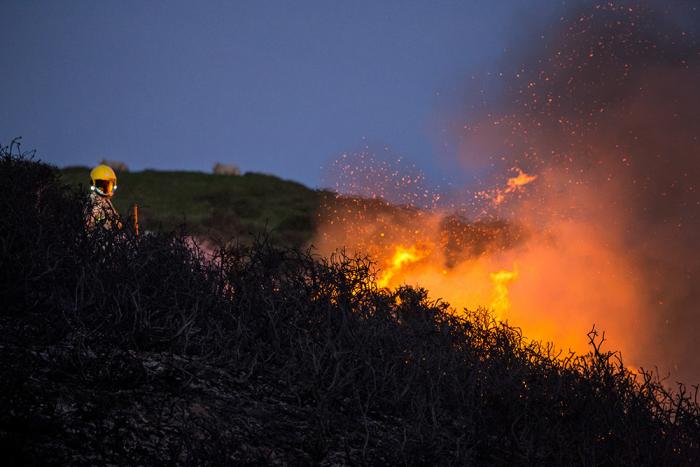
4,909 bushfires

Bushfires are any uncontrolled vegetation fire, typically in bush, scrub or woodland.

5,320

2013-14

6,165

2014-15

5,184

2015-16

4,991

2016-17

5,248

2017-18


30 total fire ban days declared

A total fire ban is declared during extremely hot and dry weather or when fires are seriously stretching firefighting resources. It prohibits the lighting of any fires in the open air and any other activities that may start a fire.

21

2013-14

24

2014-15

47

2015-16

27

2016-17

30

2017-18

334 fires were caused by lightning strikes

Lightning can occur without a storm. When it strikes an area with a dry fuel load, fires result.

286

2013-14

478

2014-15

562

2015-16

150

2016-17

344

2017-18

6,049 volunteers attended incidents

Without the contribution of volunteers, we would not be able to provide essential emergency services to communities across the State.

5,225

2013-14

6,579

2014-15

6,777

2015-16

6,542

2016-17

6,049

2017-18

1,241 structure fires

Structure fires include homes, caravans used as permanent dwellings, businesses and warehouses. 

1,326

2013-14

1,334

2014-15

1,295

2015-16

1,406

2016-17

1,241

2017-18

12,023 000 calls received

The DFES Communications Centre is manned 24/7 with trained personnel to take emergency calls.

13,093

2013-14

14,001

2014-15

12,566

2015-16

12,605

2016-17

12,023

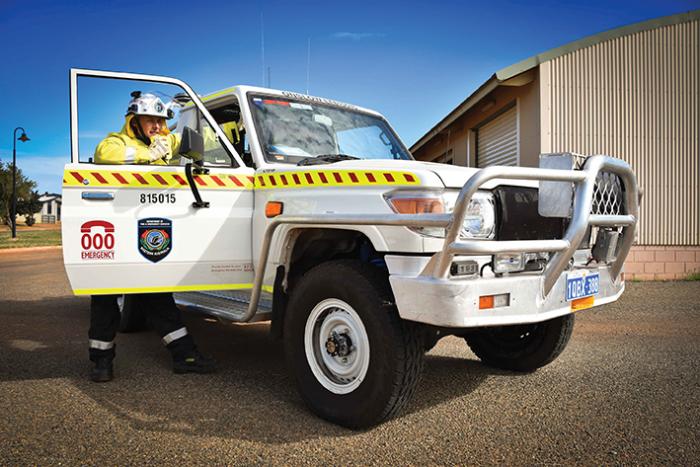
1,610 response vehicles

Our frontline crews use more than 26 different types of response vehicles. 

1,450

2013-14

1,527

2014-15

1,530

2015-16

1,577

2016-17

1,610

2017-18

over 1,800mm rain fell in the Kimberley

The Kimberley consistently receives the highest rainfall in WA.

1,200

2013-14

1,200

2014-15

900

2015-16

1,800

2016-17

1,800

2017-18


1,123,701 people visited the EmergencyWA website 3,747,014 times

The EmergencyWA website provides real-time emergency information, including incident locations, total fire ban notices and fire danger ratings.

884,715

2016-17

1,123,701

2017-18

4,578,075 litres of fire suppressant dropped by aircraft

Fire suppressants include water and other compounds that are not harmful to the environment. The aerial fleet works with frontline ground crews to extinguish fires more quickly than could be done with ground crews alone.

10,736,196

2013-14

25,740,537

2014-15

18,674,767

2015-16

6,145,398

2016-17

4,578,075

2017-18

19,201 training hours provided to volunteers

Pathways training builds volunteers’ skills and capability. Pathways also provides the opportunity to progress through the ranks and supports volunteer recognition, recruitment and retention. 

19,027

2016-17

19,201

2017-18


31.1°C was Perth’s average summer temperature

While Perth’s daily temperature can reach much higher, the average temperature has been lower over the last two years.

32

2013-14

31.4

2014-15

31.2

2015-16

29.8

2016-17

30.1

2017-18

2,815 road crash rescues

DFES supports WA Police and St John Ambulance at road crashes by freeing vehicle passengers, cleaning chemical spills and making the area safe.

2,543

2013-14

2,720

2014-15

2,836

2015-16

2,860

2016-17

2,815

2017-18

8,932 total fires

Total fires includes bushfires, structure fires, vehicle fires and fires on power lines (pole-top fires).

10,414

2013-14

10,936

2014-15

9,516

2015-16

9,585

2016-17

8,915

2017-18

629 hazardous situations

Hazardous situations include chemical spills, gas and electrical hazards (such as fallen power lines).

651

2013-14

610

2014-15

571

2015-16

558

2016-17

629

2017-18

270 Bushfire Ready Groups

Bushfire Ready Groups are designed to help communities prevent, prepare for and respond to bushfires. Community bushfire planning can reduce the impact of bushfires and aid faster recovery.

197

2015-16

236

2016-17

270

2017-18

9,000 school children took part in the Year 3 Home Fire Safety Program

The program is offered to Year 3 students across the State, and teaches fire safety in the home and how to respond if a fire occurs. 

7,700

2016-17

9,000

2017-18

378 searches

 DFES’ SES units and VMRS groups support WA Police in air, land and marine searches.  They provide rescue teams, incident management support, communications, search dogs, mounted teams, and local area knowledge.

324

2013-14

325

2014-15

314

2015-16

306

2016-17

378

2017-18

1,965 rescues (not road crash rescues)

These rescues include cliff rescues, animal rescues, freeing people locked in rooms, buildings and faulty lifts and marine recovery and towing to safety.

1,727

2013-14

1,918

2014-15

1,820

2015-16

2,387

2016-17

1,965

2017-18

2,024 severe storm requests for assistance

Severe storms cause damage right across WA. The SES supports communities to recover and clean up prior to any necessary repairs.

1,306

2014-15

441

2015-16

1,095

2016-17

2,024

2017-18